

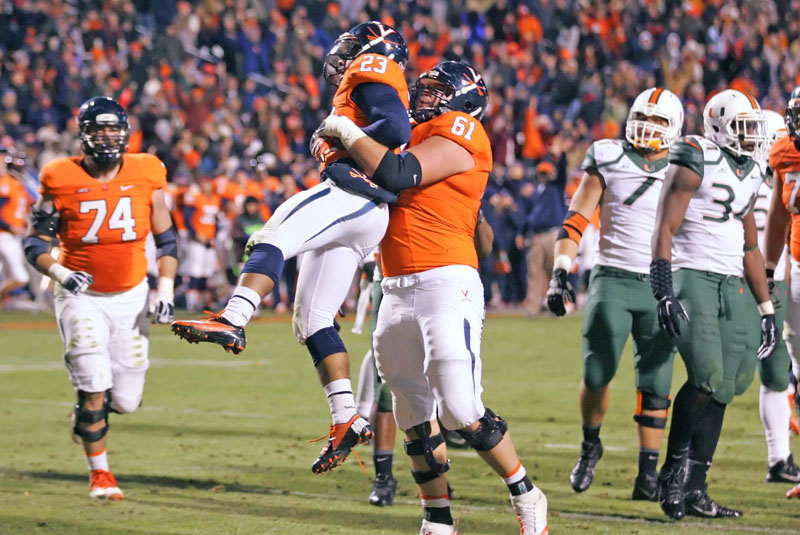
At first glance, the grades may appear high for a 5-7 team. But it is my contention that after analyzing the grades and several key indicators, the Hoos performed at a level equivalent to that of a team with 7-plus wins this season.
Let’s first take a look at the 2014 grades, how that compares to 2013, and the season’s first half (a 4-2 start) and second half (a 1-5 finish). Plus, there are some superlatives. From there, I’ll take a deeper dive into my contention.
The grades indicate Mike London’s team was better in 2014. Out of 12 units, only two failed to improve on their 2013 grades. Those operations were place kicking and punt return. Interestingly, punt return was one of only two units that improved their grade from the first half of the 2014 season to the second half. Kickoff return was the other.
Greg’s Grades
| 2013 Grades | 2014 Grades | 2014 Games 1-6 | 2014 Games 6-12 | |
|---|---|---|---|---|
| Offense Overall | 75.4 | 80.1 | 84.6 | 75.7 |
| QB | 71.5 | 73.9 | 77.2 | 69.8 |
| RB | 79 | 84.8 | 87.9 | 82.2 |
| WR/TE | 77.8 | 81.7 | 86.7 | 76.3 |
| OL | 73.7 | 79.9 | 86.7 | 74.5 |
| Defense Overall | 77.6 | 86.4 | 90.2 | 83.1 |
| DL | 80.0 | 88.9 | 92.1 | 85.5 |
| LB | 77.1 | 87.4 | 91.3 | 84.1 |
| DB | 74.4 | 82.9 | 87.2 | 79.5 |
| Special Teams Overall | 78.3 | 80.9 | 81.3 | 79.5 |
| PK | 94.7 | 95.4 | 100 | 92.7 |
| KC | 74.4 | 88.5 | 88.7 | 87.7 |
| KR | 67.8 | 78.5 | 73.4 | 79.1 |
| PC | 80 | 74.1 | 78.1 | 67.8 |
| PR | 69 | 68.1 | 66.1 | 70.2 |
Superlatives
- Top Overall Unit (Non-special teams): Defensive Line (B+) 88.9
- Top Offensive Unit: Running Back (B) 84.8
- Top Defensive Unit: Defensive Line (B+) 88.9
- Top Special Teams Unit: Placekicking (A) 95.4
- Most Improved Unit from 2013: Kickoff Coverage (+14.1)
- Most Improved Unit 1st half to 2nd half 2014: Kickoff return (+5.7)
Trend Report
Over the years of doing these grades, I’ve tried to find broader approaches to measuring a team’s success or lack thereof in a given game or season. While it’s still insightful to look at specific, micro-type trends, this season-ending review will delve mostly into the broader data.
...Subscribe to read full story
Tired of low effort articles and clickbait? So are we. Subscribe to read great articles written by a full-time staff with decades of experience.
Already a subscriber? Login Here