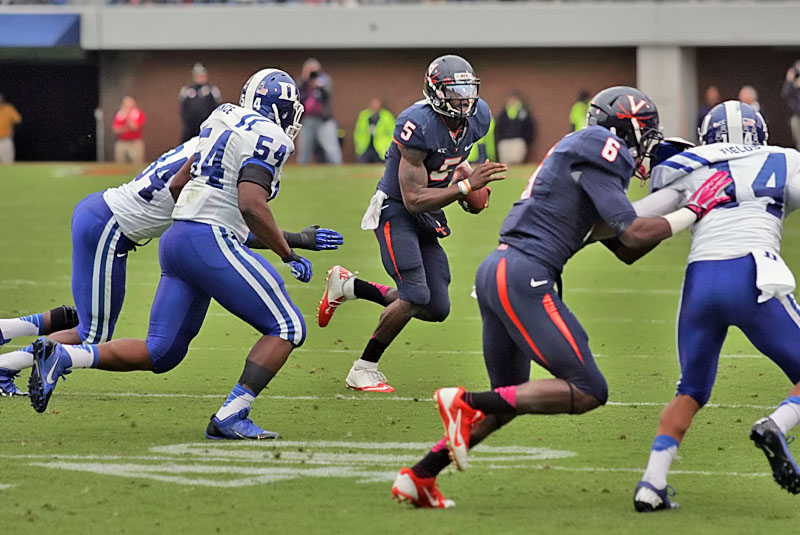
With the 2013 season mercifully in the rearview mirror, it is time to take break down the season grades and what trends impacted Virginia’s play throughout the year. I’ll look at the best and worst efforts of the season and what operations had the biggest impact on the season’s results.
One of the more interesting discoveries in the postseason grade review is that two of Virginia’s top three offensive days were coupled with two of the three worst performances by the defense. Overall the worst game for the offense and defense was the 59-10 loss to Clemson, while the worst overall performance combining all three units was the loss at Chapel Hill where the team graded out with a total mark of 69.5. Aided by a 98.1 and a 97.4 for the special teams defense respectively, the BYU game was the top overall grade for the season coming in at 89.4.
Greg’s Grades
Please note, that the grades reflect only the 11 FBS games and do not include the VMI contest. First, here is the season table.
2013 Football Season Grades
| Units | QB | RB | WR/TE | OL | OFF | DL | LB | DB | DEF | KOC | KOR | PC | PR | PK | ST |
|---|---|---|---|---|---|---|---|---|---|---|---|---|---|---|---|
| First 5 Games (FBS) | 75.1 | 78.4 | 76.5 | 72.1 | 75.5 | 84.2 | 80.0 | 77.4 | 81.3 | 78.5 | 67.4 | 83.9 | 72.7 | 98.7 | 80.2 |
| Final 6 Games (FBS) | 68.3 | 79.5 | 79.1 | 75.3 | 75.4 | 75.9 | 74.2 | 71.5 | 73.8 | 70.3 | 68.1 | 76.0 | 65.3 | 90.6 | 74.0 |
| Season Total | 71.5 | 79 | 77.8 | 73.7 | 75.4 | 80.0 | 77.1 | 74.4 | 77.6 | 74.4 | 67.8 | 80.0 | 69.0 | 94.7 | 78.3 |
Overview
...Subscribe to read full story
Tired of low effort articles and clickbait? So are we. Subscribe to read great articles written by a full-time staff with decades of experience.
Already a subscriber? Login Here


